Measuring Cross-Sectional Variation in Expected Returns: A Machine Learning Approach

Preparing for submission

Asset pricing
Machine learning
Author
Affiliation

Douglas Laporte

Washington University in St. Louis

Published

February 2024

Abstract
I develop and test a new machine learning method for estimating cross-sectional firm-level expected returns. My approach adapts the loss function of a random forest algorithm to minimize the variance of measurement errors instead of trading off bias and variance. It yields higher cross-sectional accuracy out-of-sample than alternative estimates. I find that expected returns and the firm characteristics that explain them vary substantially across holding horizons. Applying this new approach, I show that cross-sectional differences in expected returns are larger and persist longer than previously documented, and I overturn prior results on the association between earnings smoothness and expected returns.

SSRN

Main figures

Figure 1: Hypothetical example for an investor choosing between an expected return proxy with zero measurement error variance (MEV) and another with low mean-squared error (MSE) to implement a long-short trading strategy. Even though the proxy with zero MEV overstates true expected returns by 2%, it provides the relevant information because the measurement error is the same for the three stocks (A, B, and C).

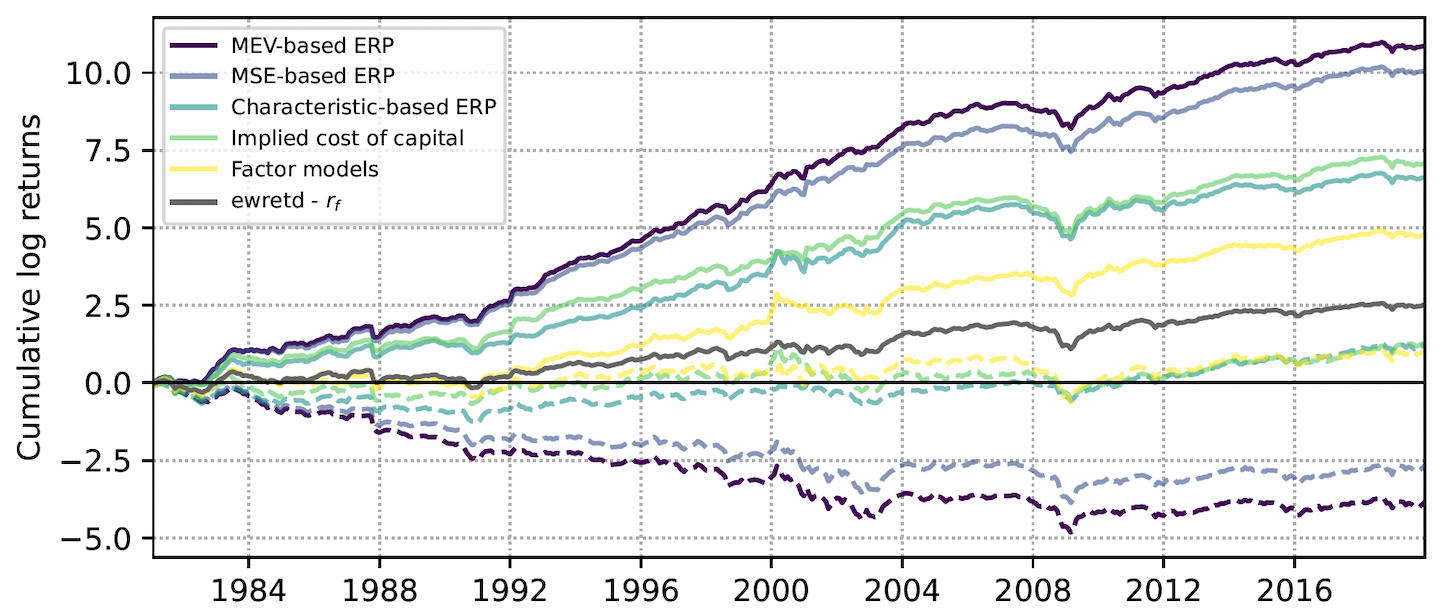
Figure 2: Cumulative log excess returns of equal-weighted portfolios of stocks in the highest (solid lines) and lowest (dashed lines) deciles of expected returns based on various proxies. Portfolios are rebalanced monthly.